EIA-861 · 2024 filings
The storm belt, measured.
We computed the storm-vs-blue-sky outage ratio for all 723 utility filings. Tampa Electric came out 60 times worse.
· FlowMatrix Research
- extra outage hours storms added for Duke Energy Carolinas customers in South Carolina
- +127 h
- Source: EIA-861, 2024
- median multiplier across the 163 utilities serving 100,000 or more customers
- 1.9×
- Source: FlowMatrix Research
- thirteen of those big utilities. Their storm year looked like their normal year
- 1.0×
- Source: FlowMatrix Research
Every utility files two outage numbers with the government each year. One counts normal days. The other adds major storm days back in.1 We divided one by the other for all 723 usable filings.2 We call the result the storm multiplier.

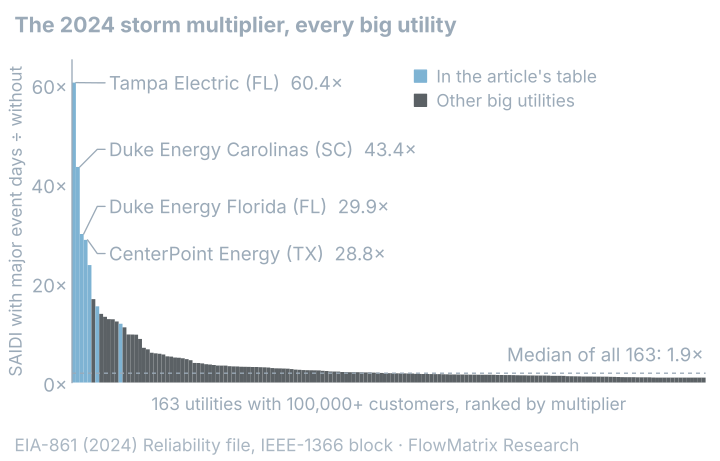
The 2024 table reads like the hurricane season. Tampa Electric came out 60 times worse with storms counted. Duke Energy Carolinas in South Carolina: 43 times. CenterPoint in Houston: 29 times.1 The filing does not say which storms did it; it only counts the days. The hurricane record does. Milton came ashore south of Tampa Bay in October, Helene crossed the Carolinas in September, and Beryl passed over the west side of Houston in July.345 Pairing each utility’s year with one storm is our reading of the two records side by side, not something the data states.
“Sustained periods without major power disruptions can lead, and in the past have led, to reduced consumer awareness of the benefits of standby and portable generator products.”
— Generac Holdings, Form 10-K for fiscal 20256
The North American Electric Reliability Corporation “has labeled significant portions of the United States and Canada as being at high or elevated risk of resource adequacy shortfalls in the 2025-2029 period.”
— Generac Holdings, describing NERC’s assessment in the same filing6
The 2024 table

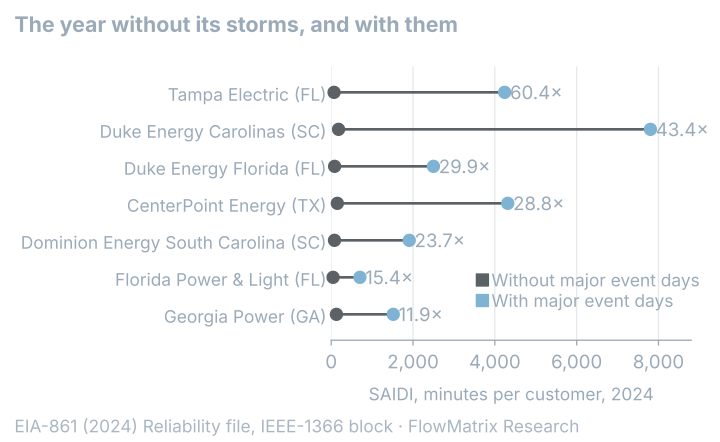
SAIDI is minutes of outage per customer over the year. The two SAIDI columns are printed as EIA files them, to two decimals, so the multiplier reproduces from the row: divide the all-in column by the blue-sky column.
| Utility | State | Customers | Blue-sky SAIDI (min) | All-in SAIDI (min) | Multiplier |
|---|---|---|---|---|---|
| Tampa Electric | FL | 869,995 | 70.14 | 4,239.69 | 60.4× |
| Duke Energy Carolinas | SC | 670,391 | 179.62 | 7,803.74 | 43.4× |
| Duke Energy Florida | FL | 2,016,207 | 83.51 | 2,499.54 | 29.9× |
| CenterPoint Energy | TX | 2,847,806 | 150.09 | 4,315.81 | 28.8× |
| Dominion Energy South Carolina | SC | 816,766 | 80.61 | 1,908.47 | 23.7× |
| Florida Power & Light | FL | 5,976,022 | 45.69 | 702.08 | 15.4× |
| Georgia Power | GA | 2,717,959 | 127.94 | 1,516.16 | 11.9× |
The other end of the table is flat. LA Water & Power, Pedernales Electric, and El Paso Electric all sat at 1.0, and so did ten other big utilities.1 Their storm year looked like their normal year.
The state view

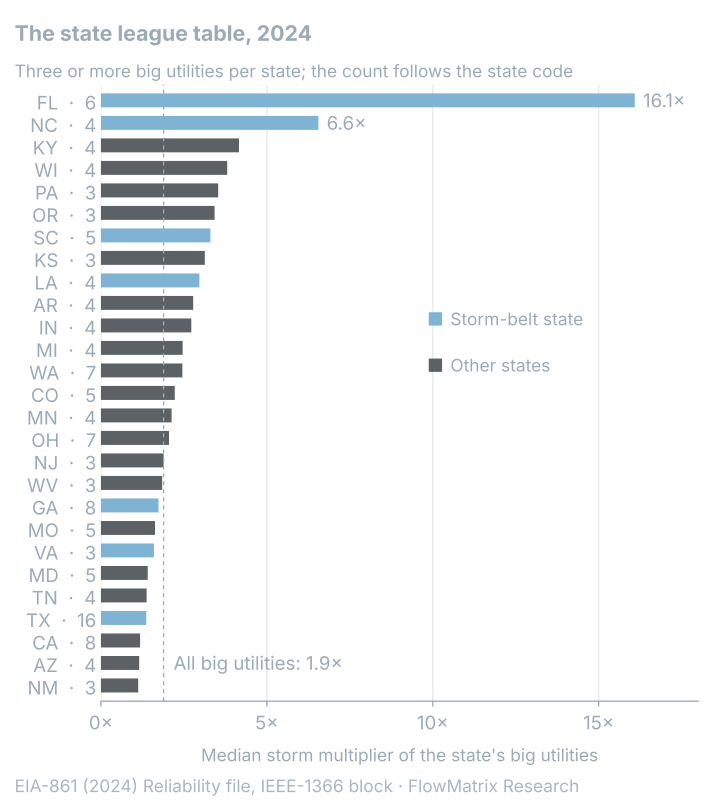
We call nine states the storm belt: Texas, Louisiana, Mississippi, Alabama, Florida, Georgia, South Carolina, North Carolina and Virginia. The median big utility in the country ran 1.9×; the median big storm-belt utility ran 2.0×.2 That gap is small because the belt is not one thing. Florida’s big utilities ran a median of 16.1×, North Carolina’s 6.6×, South Carolina’s 3.3× and Louisiana’s 3.0×, all above the national line. Georgia (1.7×), Virginia (1.6×) and Texas (1.4×) sat below it, and Mississippi and Alabama have too few big utilities to rank.2 Four of the nine storm-belt states run above the national median, and Florida is the outlier that makes the belt look like one.
Note
The arithmetic. Duke Energy Carolinas customers in South Carolina lost 127 extra hours to storms in 2024: 7,803.74 minus 179.62 minutes, divided by 60.1
That is five full days and nights, per customer.
Take a county with 40,000 homes as a worked example: about 5 million home-hours dark, in one year, from storms alone. The county is invented; the 127 hours is not.
“The storms made this grid sixty times worse last year.” A homeowner understands that in one sentence.
What the number means on a porch
The multiplier is not a grade for the utility. It measures what the weather did to that grid, plus how long repairs took. Homeowners do not live in the blue-sky number. They live in the all-in number.
One more thing the table says. Storm demand arrives all at once, and it does not wait; the companion piece measures how fast it leaves. Our reading of that, and it is an argument rather than a measurement: whoever answers the phone first that week wins the season.
Method and sources
EIA-861 (2024 final release) Reliability file, IEEE-1366 block, one row per utility-state filing. Multiplier = SAIDI with major event days divided by SAIDI without. Rows missing either SAIDI value or the customer count are dropped; one row whose “without” SAIDI exceeded its “with” SAIDI was excluded as impossible, and two rows with a “without” SAIDI of zero have no defined multiplier and were excluded. 723 rows remain. “Big” = 100,000 or more customers (163 rows). State medians are over big utilities only, for states with at least three. SAIDI is self-reported and EIA does not audit it. The multiplier reflects one year of storm exposure plus restoration, not utility quality alone. The computation, its tests and the output table are in the public article-data repository at the commit recorded on this page.
Sources
- US Energy Information Administration, Form EIA-861 (2024 final release), Reliability file, sheet Reliability_States, IEEE-1366 block — https://www.eia.gov/electricity/data/eia861/ · Public domain
- FlowMatrix Research computation from the EIA-861 file, September 2026. Output storm-multiplier-2024.csv in the public article-data repository at the commit recorded on this page · analysis
storm-multiplierata06297e25aa3e52f2c32b5855f03b6fad8e85e06 - National Hurricane Center, Tropical Cyclone Report, Hurricane Milton (AL142024), final — https://www.nhc.noaa.gov/data/tcr/AL142024_Milton.pdf · Public domain
- National Hurricane Center, Tropical Cyclone Report, Hurricane Helene (AL092024), final, updated 2026-02-17 — https://www.nhc.noaa.gov/data/tcr/AL092024_Helene.pdf · Public domain
- National Hurricane Center, Tropical Cyclone Report, Hurricane Beryl (AL022024), final, updated 2025-05-01 — https://www.nhc.noaa.gov/data/tcr/AL022024_Beryl.pdf · Public domain
- Generac Holdings Inc., Form 10-K for the fiscal year ended 2025-12-31, filed 2026-02-18 (SEC accession 0001437749-26-004568), Item 1 — https://www.sec.gov/Archives/edgar/data/1474735/000143774926004568/gnrc20251231_10k.htm · Public record