Google Trends · 2024 hurricanes
Five to ten days.
After each 2024 hurricane, search interest for whole-home generators fell back to its pre-storm level within five to ten days. We measured the window every dealer talks about.
· FlowMatrix Research
- days for Texas interest to return to baseline after Beryl, the longest we measured
- 10
- Source: FlowMatrix Research
- Florida's peak after Milton against its pre-storm level, on a 7-day mean. The only multiple our data can support
- 14×
- Source: FlowMatrix Research
Dealers tell us the buying window after an outage lasts about a week. We put a ruler on it. Google publishes daily search interest by state.1 We pulled “whole house generator” around all three 2024 hurricane landfalls, one state per storm: Texas for Beryl, North Carolina for Helene, Florida for Milton.234

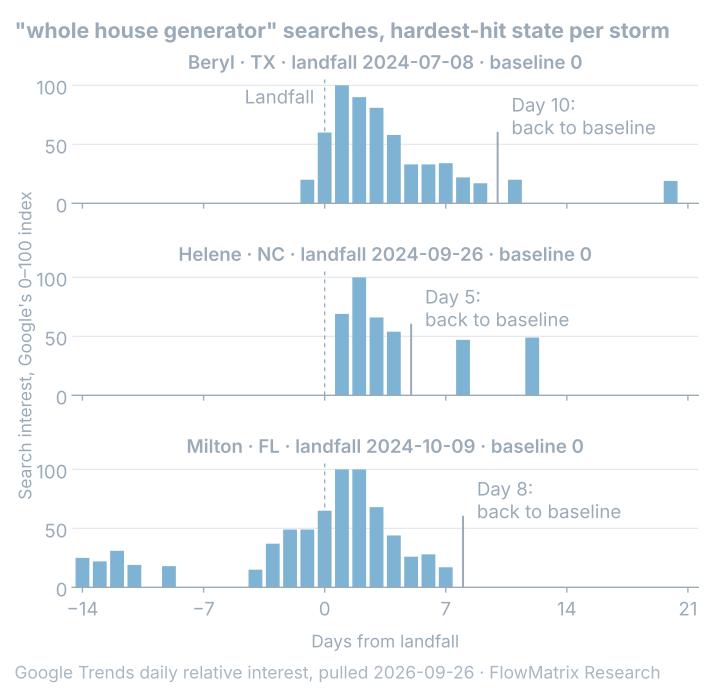
The pattern held every time. Interest peaked one or two days after landfall. Then it collapsed: back to the pre-storm level in five, eight and ten days.5
The wave, by storm
| Event | State | Landfall | Peak day | Back to baseline | Peak vs pre-storm level (7-day mean) |
|---|---|---|---|---|---|
| Beryl | Texas | 2024-07-08 | day 1 | 10 days | undefined: pre-storm level was 0 |
| Helene | North Carolina | 2024-09-26 | day 2 | 5 days | undefined: pre-storm level was 0 |
| Milton | Florida | 2024-10-09 | day 1 | 8 days | 14.4× |
The multiples are the honest gap in this table. Google’s index scores the quietest days as zero, and in Texas and North Carolina every one of the 21 pre-storm days we use as the baseline was a zero. A spike measured against nothing is not a number, so we do not print one. Florida’s pre-storm level was not zero, and its peak ran 14.4 times that level on a 7-day mean.5
Nationally, the same weeks ran about three times the June level: 2.8× for Beryl, 3.5× for Helene, 3.2× for Milton, on a 7-day mean of the US series.5 Then the line fell off a cliff.
“We audited 2,241 U.S. companies, measuring how long each took to respond to a web-generated test lead. … 23% of the companies never responded at all. The average response time, among companies that responded within 30 days, was 42 hours.”
— Oldroyd, McElheran and Elkington, “The Short Life of Online Sales Leads,” Harvard Business Review, March 20116
Firms that tried to contact potential customers within an hour of receiving a query were “nearly seven times as likely to qualify the lead … as those that tried to contact the customer even an hour later.”
— the same study6
A 2007 vendor study, run on InsideSales.com data by James Oldroyd before the HBR work, put the gap between a five-minute and a thirty-minute response at 100 times on contact odds.7 It has no public archival copy, so we cite it as context for the HBR finding, not as evidence of our own.
Note
The arithmetic. A worked example, not a measurement. Say a storm week brings 30 calls a day, and take Florida’s window of 8 days. That is 240 chances.
Generac puts the installed cost of a home standby generator at $8,000 to $16,000, generator included.8
Close just 1 in 10, at $12,000 each, the middle of that range: the window carries about $288,000.
Every call that rings out hands one of those chances to the next voice.
What the shape of the wave means
Three things are true at once. The demand is huge and immediate. People search from dark driveways within a day or two of landfall.
Second, the first wave breaks within five to ten days. Not to nothing: North Carolina was back at its pre-storm level on day 5 and then spiked again on days 8 and 12, and the chart shows both. But the wave that landfall raises had collapsed within ten days in every state we measured. Texas, at 10 days, was the longest.5
Third, the window opens when your shop is least able to answer. Crews are out. The office phone is ringing. That part is what dealers tell us, not what we measured. The storm does the marketing. Those ten days decide who gets paid for it.
Method and sources
Google Trends daily relative interest for “whole house generator,” one state per storm (Texas, North Carolina, Florida) and the United States, 2024-05-15 to 2024-12-15, pulled 2026-09-26 through the unofficial endpoint and pinned as a CSV in the public article-data repository. Landfall dates are the local calendar dates from the National Hurricane Center’s final reports. Baseline = median of the 21 days ending 3 days before landfall. Peak = the maximum in the 45 days from landfall. “Back to baseline” = the first day on or after the peak at or below 125% of baseline, reported as days from landfall. Multiples are peak over baseline on a trailing 7-day mean, and are undefined where the baseline is zero. National multiples compare each storm’s peak in the 7-day-mean US series with that series’ June 2024 median. Trends values are relative indices scaled 0-100 within each pull, not volumes; a pull on another day can differ by a few points, which is why the pull date is on this page.
Sources
- Google Trends, daily relative search interest for "whole house generator" by state and for the United States, 2024-05-15 to 2024-12-15, pulled 2026-09-26 and pinned in the public article-data repository at the commit recorded on this page — https://trends.google.com/ · Cited per Google terms; relative indices, not volumes
- National Hurricane Center, Tropical Cyclone Report, Hurricane Beryl (AL022024), final, updated 2025-05-01. Texas landfall near Matagorda at 0840 UTC 8 July 2024 — https://www.nhc.noaa.gov/data/tcr/AL022024_Beryl.pdf · Public domain
- National Hurricane Center, Tropical Cyclone Report, Hurricane Helene (AL092024), final, updated 2026-02-17. Florida landfall southwest of Perry at 0310 UTC 27 September 2024 (11:10 pm EDT, 26 September) — https://www.nhc.noaa.gov/data/tcr/AL092024_Helene.pdf · Public domain
- National Hurricane Center, Tropical Cyclone Report, Hurricane Milton (AL142024), final. Florida landfall at Siesta Key at 0030 UTC 10 October 2024 (8:30 pm EDT, 9 October) — https://www.nhc.noaa.gov/data/tcr/AL142024_Milton.pdf · Public domain
- FlowMatrix Research computation from the pinned Trends series, September 2026. Outputs seven-day-window.csv and seven-day-window-national.csv in the public article-data repository · analysis
seven-day-windowata06297e25aa3e52f2c32b5855f03b6fad8e85e06 - Oldroyd, McElheran and Elkington, "The Short Life of Online Sales Leads," Harvard Business Review 89, no. 3 (March 2011) — https://hbr.org/2011/03/the-short-life-of-online-sales-leads
- Lead Response Management Study, 2007. InsideSales.com data analysed by James Oldroyd, then an MIT Sloan Faculty Fellow. A vendor study with no public archival copy; cited as context, not as our evidence
- Generac Power Systems, "Backup Generator Installation" (generac.com/resources/home-management/backup-generator-installation), retrieved 2026-09-26; Internet Archive snapshot of 2026-09-17 — https://web.archive.org/web/20260917141219/https://www.generac.com/resources/home-management/backup-generator-installation/