Census + EAGLE-I
The gap counties.
We crossed Census home data with nine years of outage records. These counties have the most qualifying homes and the worst grids.
· FlowMatrix Research
- county equivalents we rebuilt the qualifying-home count for, at a $300,000 home-value threshold
- 3,222
- Source: FlowMatrix Research
Generac defines its market simply. Single-family detached homes, owner-occupied, worth over $175,000.1 Only about 1 in 15 has a standby unit.1
We could not find a published county map of where the other 14 live. So we built the table. We rebuilt a version of the definition from Census data for all 3,222 county equivalents, using a $300,000 home-value threshold rather than Generac’s $175,000, which makes our count narrower than theirs.2 Then we crossed it with nine years of federal outage records.3

“With only approximately 6.75% penetration of the addressable market of homes in the United States (which we define as single-family detached, owner-occupied households with a home value of over $175,000 …), we believe there are significant opportunities to further penetrate the residential standby generator market both domestically and internationally.”
— Generac Holdings, Form 10-K for fiscal 20251
“Today, we’re only 6.75% penetrated. And every 1% of penetration is a $4.5 billion market opportunity.”
— Aaron Jagdfeld, Generac CEO, Q4 2025 earnings call4
The table
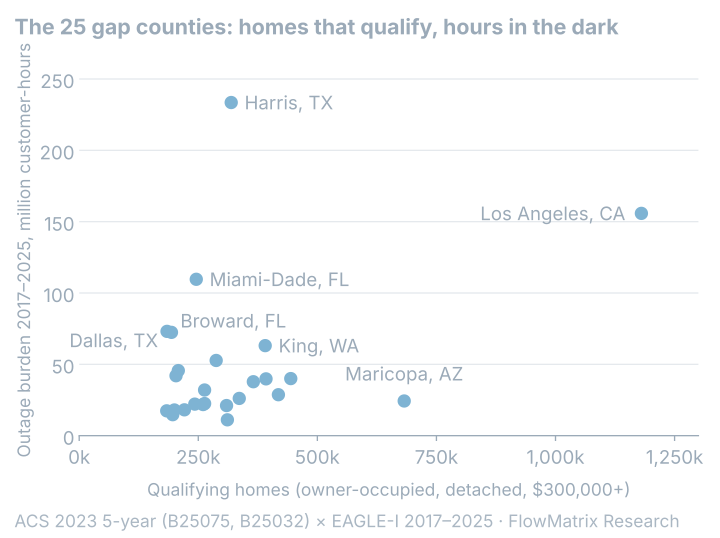
These counties sit in the top quartile for outage burden. They also hold the most qualifying homes. Both things at once. The table is the first twelve; the chart plots all twenty-five.5
| County | Qualifying homes at $300,000+ (nearest 1,000) | Outage burden 2017-2025 (M customer-hours) |
|---|---|---|
| Los Angeles, CA | 1,180,000 | 155.8 |
| Maricopa, AZ | 682,000 | 24.3 |
| San Diego, CA | 444,000 | 40.0 |
| Orange, CA | 418,000 | 28.7 |
| Cook, IL | 392,000 | 39.8 |
| King, WA | 391,000 | 63.1 |
| Riverside, CA | 366,000 | 37.8 |
| Suffolk, NY | 336,000 | 26.1 |
| Harris, TX | 319,000 | 233.5 |
| Clark, NV | 311,000 | 11.1 |
| Nassau, NY | 309,000 | 21.1 |
| San Bernardino, CA | 288,000 | 52.7 |
Look at Harris County, Texas. 319,000 qualifying homes. 233.5 million customer-hours of dark in nine years: the most on the list, and half again as much as Los Angeles, the next highest. That is Houston, and it is Beryl country: Beryl’s centre crossed the west side of the Houston metropolitan area on 8 July 2024, and the National Hurricane Center puts the power loss at 2.7 million people in southeastern Texas.6
Note
The arithmetic we did not do. It is tempting to take Harris County at Generac’s 6.75 percent and print how many of its 319,000 homes have no standby unit. We have not, because the rate and the base are different populations: 6.75 percent is Generac’s penetration of its own market, defined at $175,000; our 319,000 is a narrower count at $300,000. Multiplying one by the other would be borrowing a number. What the table does say is that Harris County holds 319,000 homes that clear a high value bar, in the county the grid failed hardest.
What this list is for
Dealers tell us they pick territory by feel and by franchise map. This table is a third input. It says where the buyers and the blackouts already overlap.
The homes do not go away when storms do. The gap waits.
Method and sources
Qualifying homes from ACS 2023 5-year estimates: owner-occupied units valued at $300,000 or more (B25075 buckets 021-027), scaled by each county’s owner-occupied single-family-detached share (B25032), rounded to whole homes in the output and to the nearest thousand in the table. This is a proxy for standby-generator eligibility, narrower than Generac’s definition (no income, lot, fuel or permitting criteria, and a higher value bar): our national total at $300,000 is 33.7 million homes across 3,222 county equivalents, which include the District of Columbia and Puerto Rico’s 78 municipios. At Generac’s $175,000 the same method gives 50.9 million homes and a different top 25; we publish the $300,000 count and give the broader figure so the gap between the two definitions is visible. Outage burden = EAGLE-I county customer-hours (15-minute snapshots of customers out, times 0.25), summed over 2017-2025; the archive’s own coverage ramps through 2014-2016, so those years are left out. 121 county equivalents have no EAGLE-I match and drop out of the ranking, leaving 3,101; the top quartile of burden (about 2.6 million customer-hours and up, 776 counties) is kept and ranked by qualifying homes. Customer-hours scale with county size, so this is a list of large, exposed counties, not of the most outage-prone ones. ACS margins of error are large in small counties.
Sources
- Generac Holdings Inc., Form 10-K for the fiscal year ended 2025-12-31, filed 2026-02-18 (SEC accession 0001437749-26-004568), Item 1, "Home standby penetration opportunity is significant" — https://www.sec.gov/Archives/edgar/data/1474735/000143774926004568/gnrc20251231_10k.htm · Public record
- US Census Bureau, American Community Survey 2023 5-year estimates, tables B25075 (value, owner-occupied units) and B25032 (tenure by units in structure), table-based summary files — https://www2.census.gov/programs-surveys/acs/summary_file/2023/table-based-SF/ · Public domain
- Oak Ridge National Laboratory, EAGLE-I Recorded Electricity Outages 2014-2025, figshare 24237376 version 4 (doi:10.6084/m9.figshare.24237376.v4); years 2017-2025 used — https://doi.org/10.6084/m9.figshare.24237376.v4 · CC BY 4.0
- Generac Holdings Q4 2025 earnings call, 2026-02-11, Aaron Jagdfeld (CEO). Transcript by The Motley Fool — https://www.fool.com/earnings/call-transcripts/2026/02/11/generac-gnrc-q4-2025-earnings-call-transcript/
- FlowMatrix Research computation from the ACS and EAGLE-I files, September 2026. Outputs acs-qualifying-homes.csv, eaglei-county-burden-2017-2025.csv and penetration-gap-top25.csv in the public article-data repository at the commit recorded on this page · analysis
penetration-gapata06297e25aa3e52f2c32b5855f03b6fad8e85e06 - National Hurricane Center, Tropical Cyclone Report, Hurricane Beryl (AL022024), final, updated 2025-05-01 — https://www.nhc.noaa.gov/data/tcr/AL022024_Beryl.pdf · Public domain